How-to guides
Track usage and cost
Settings > Usage shows how many tokens your agents used and what they cost, by day, by agent and by model.
Read the Usage tab
-
Open Settings > Usage.
-
Pick a Period: Today, Last 7 days, Last 30 days or All time.
-
Pick a Measure: Cost or Tokens.
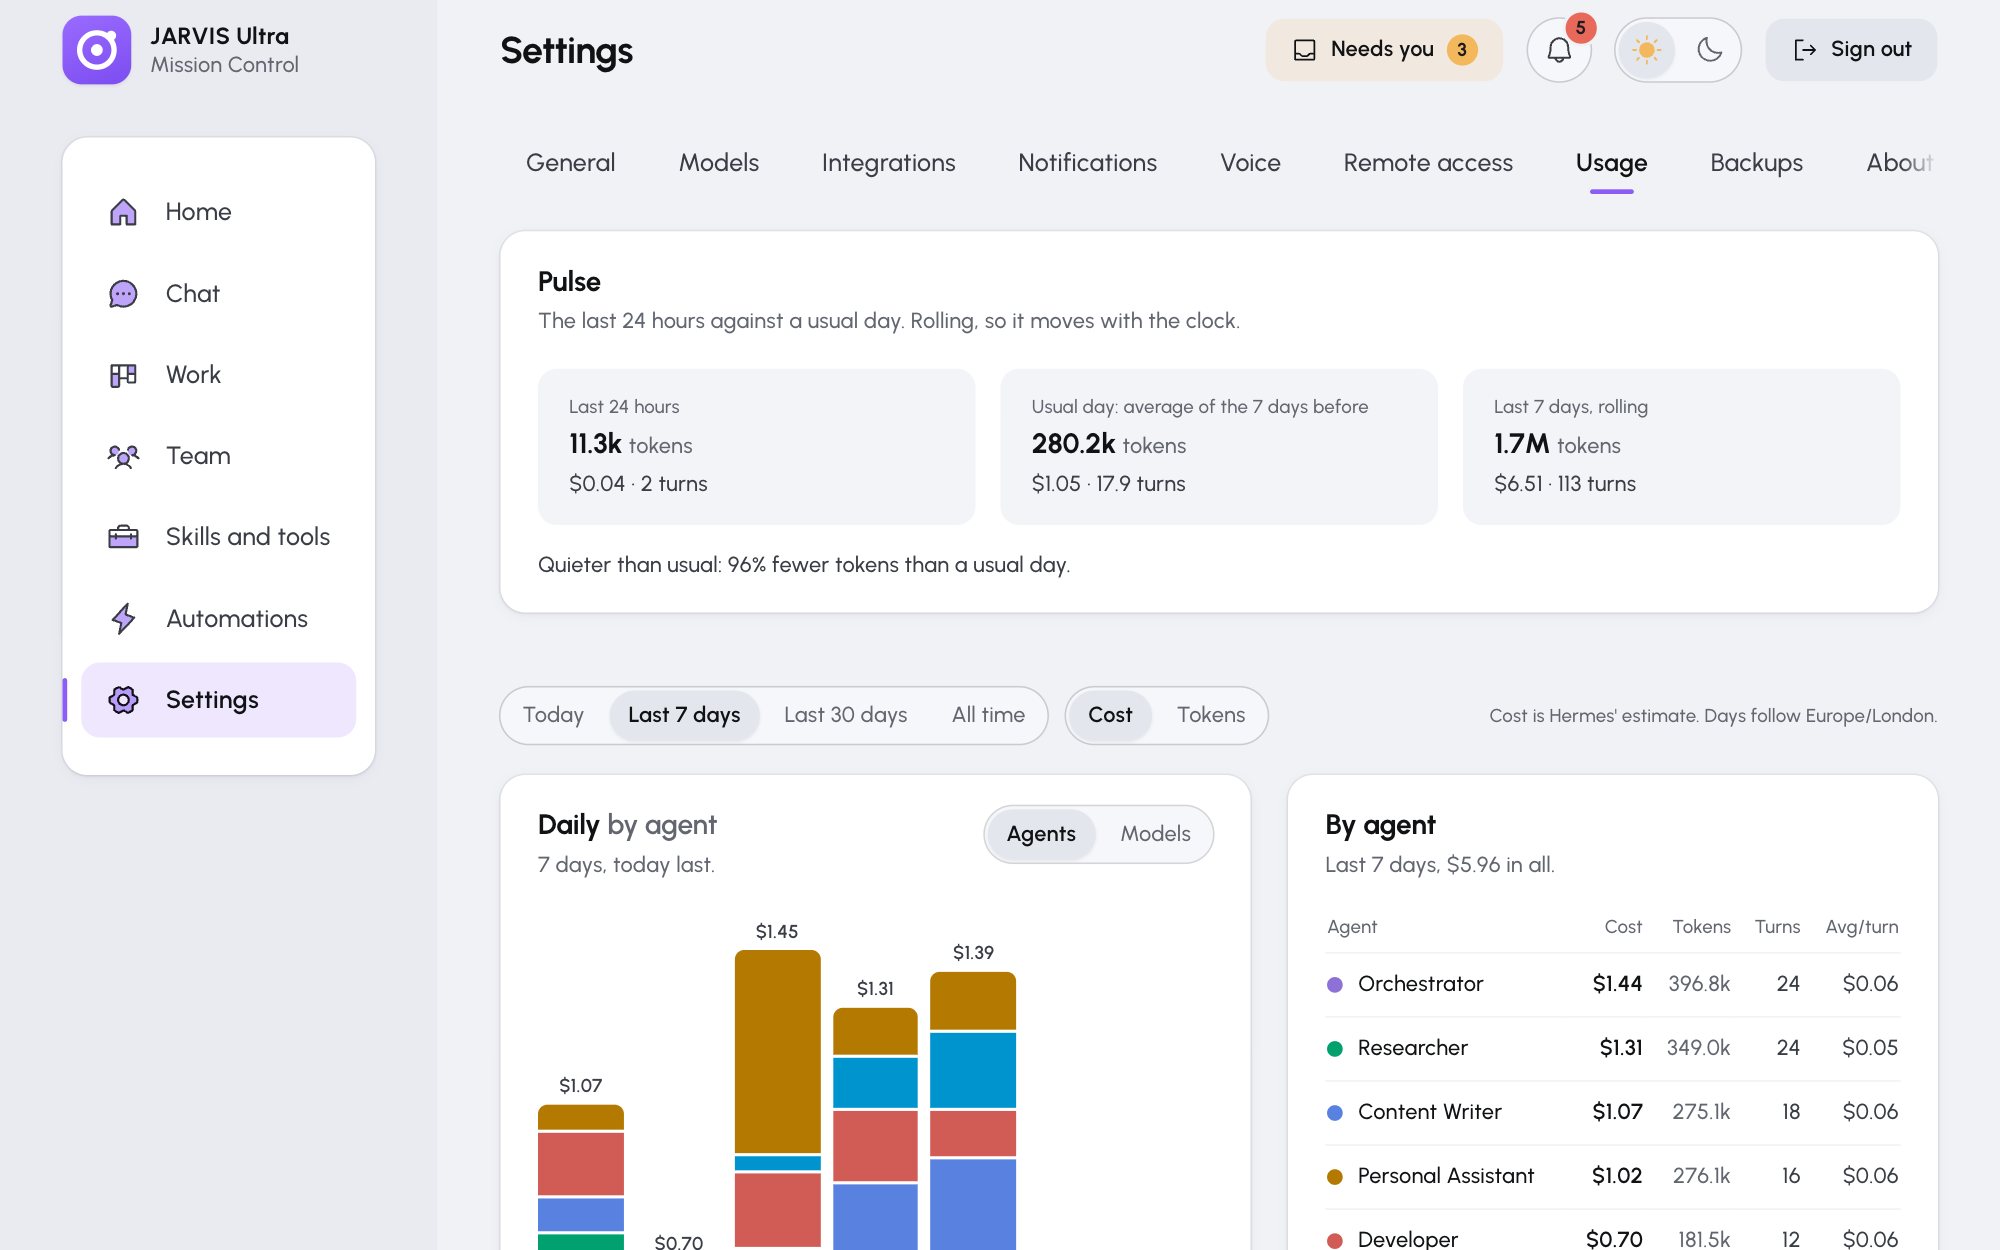
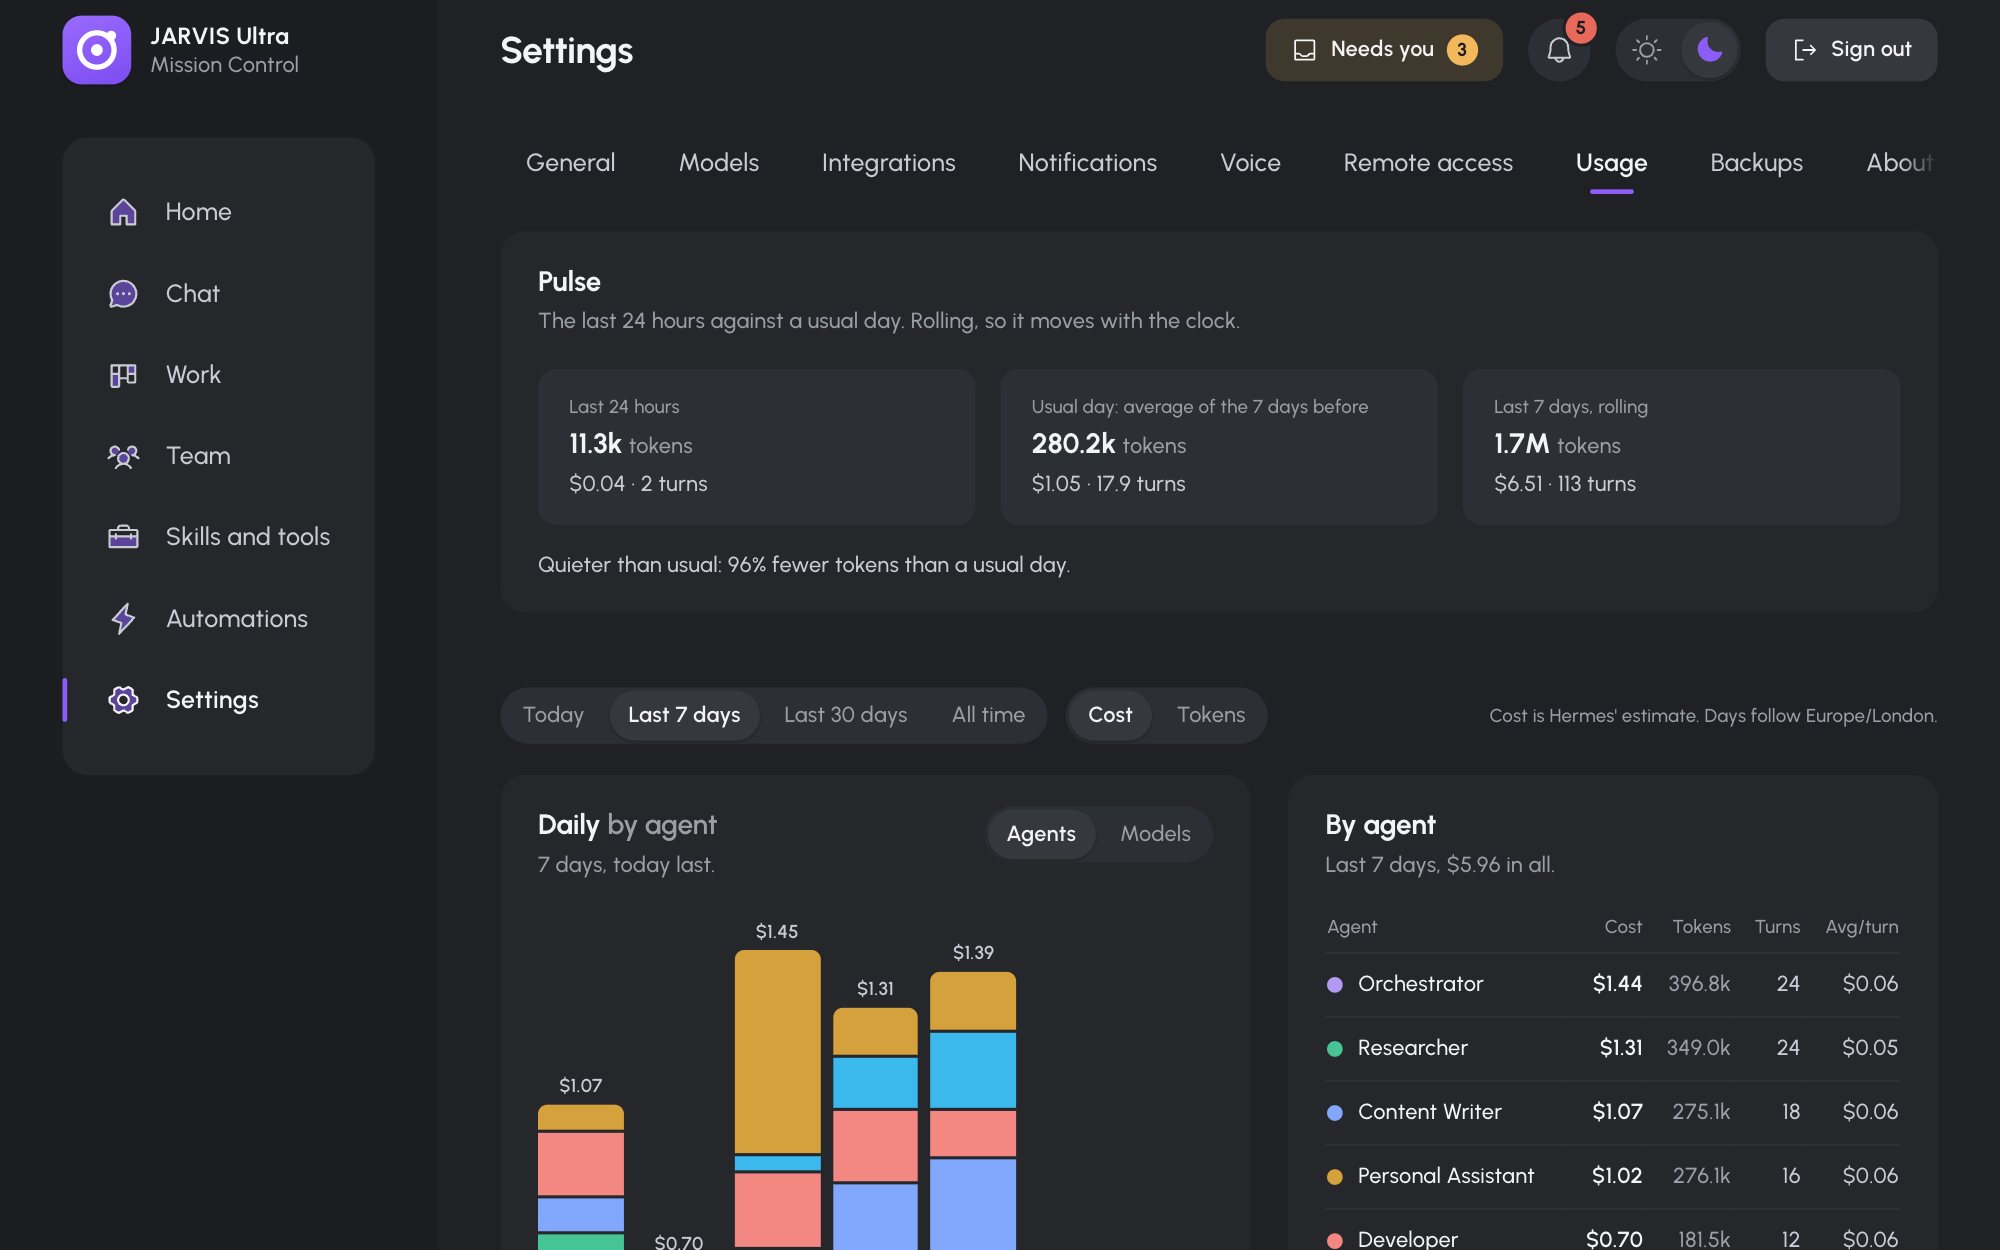
Settings > Usage over the last 7 days: Pulse on top, then Daily split by agent and By agent.
Three cards follow:
- Daily: a bar per day, split by Agents or Models (Split by). Hover over or focus a bar for that day's numbers.
- By agent: each agent's cost and tokens, turns and average per turn.
- By model: each model's share.
Pulse, at the top, compares the last 24 hours with a usual day and with the last 7 days, and says whether the team is busier or quieter.
One agent's numbers for the last 7 days are also on its Usage tab in its drawer on Team. Home > Team activity shows a heat map of turns per agent per day.
How cost is worked out
Costs are estimates. They come from Hermes, which knows each provider's prices; for a model Hermes has no price for, the dashboard estimates from the model catalog. The line under By agent counts the turns whose cost needs a word: failed turns, local turns ($0.00), turns "estimated by us", and "unpriced" turns.
Your provider's bill is the true figure. It can be higher than Usage: a failed turn counts as $0.00 here, even if the provider charged for part of it, and so does a failed try inside a turn that succeeded on a retry.
Days follow the time zone in Settings > General.